How to check crime in your neighborhood, and how to read the numbers

See more PinScene stories in your Google results.
Crime data is public and free. The hard part is reading it without scaring yourself or missing the real pattern.
The best source for crime near a specific address is usually your own police department. Many publish an online crime map or open data portal that shows reported incidents by block, type, and date, along with annual reports broken down by precinct or district. Search your city name plus "crime map" or "police open data."
For comparing cities or tracking trends over years, the FBI publishes crime reported by local agencies through its Crime Data Explorer.
About the federal data
Since January 2021, the FBI's National Incident-Based Reporting System, known as NIBRS, has been the national standard for crime reporting, according to the Bureau of Justice Statistics. It records far more detail than the older system, including a broad array of offenses, property losses, and information about victims and offenders.
As of May 2024, all 50 states and Washington, D.C., were certified to report through NIBRS, covering 82% of the U.S. population, the bureau says. That means some agencies still weren't reporting, and a city missing from a given year may simply not have submitted data.
Reading it without getting fooled
Three things trip people up.
Counts are not rates. A city of 500,000 with 1,000 burglaries has a rate of 2 per 1,000 residents. A town of 50,000 with 200 has a rate of 4 per 1,000, double the risk despite the smaller number. Always divide by population before comparing places.
Small areas swing. A single block or a neighborhood with a few thousand people can go from 3 incidents to 9 in a year, which looks like a tripling and may mean nothing. Look at several years before calling it a trend.
It's only what gets reported. Crime data counts incidents that reach police. Changes in how often people report, or how a department classifies calls, can move the numbers without any change in actual crime.
The street-level picture
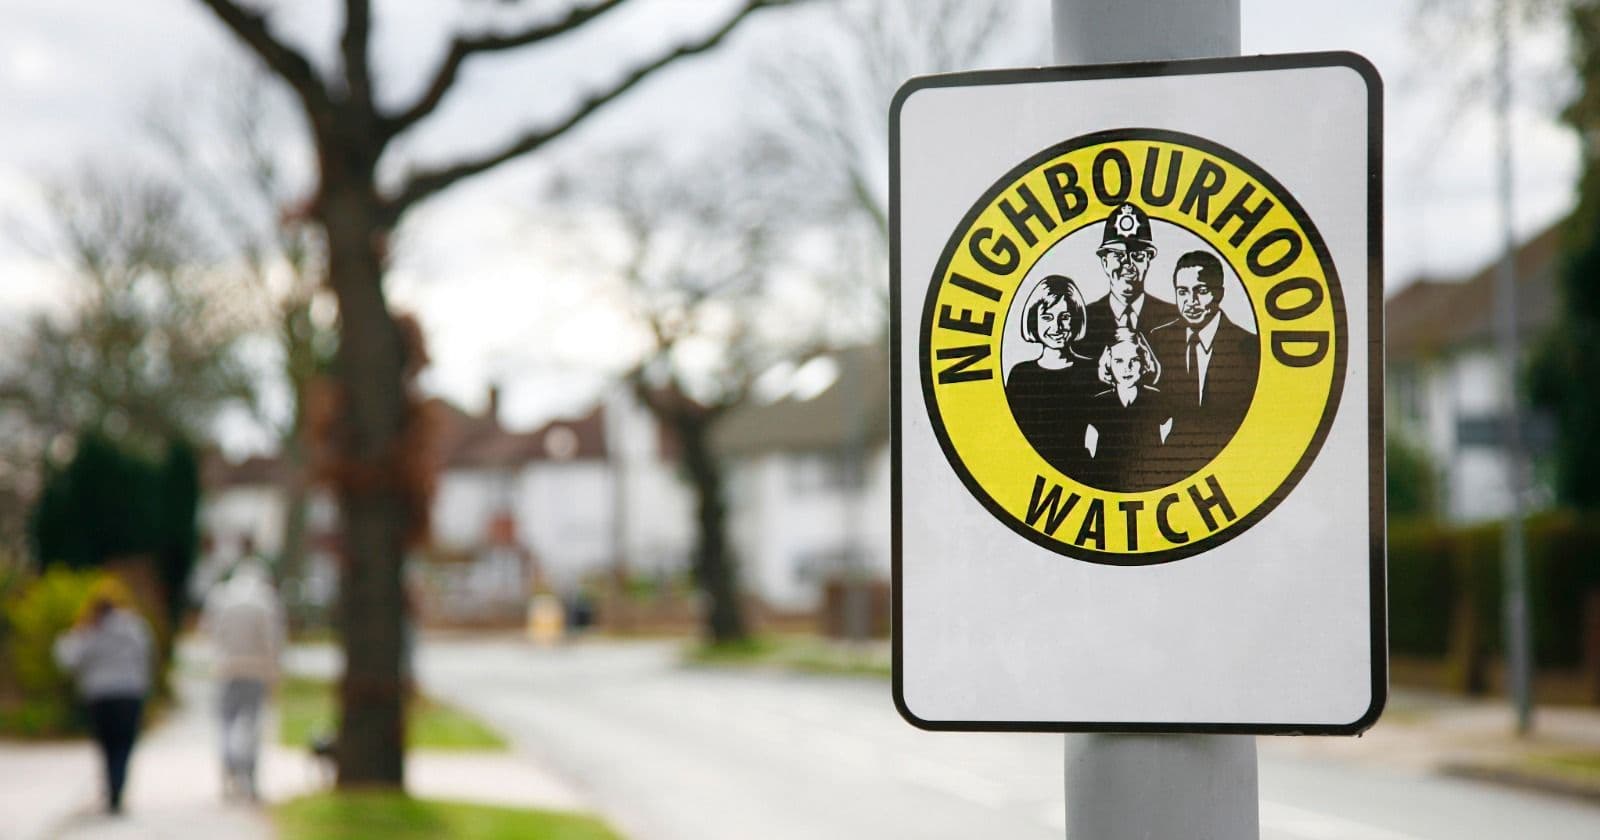
Numbers tell you about a place over a year. They don't tell you whether a car break-in happened on your street last night or why there were four cruisers at the corner this morning. For that, neighbors and a live local map are faster than any database, and police community meetings are where you can ask what's behind a spike.
Sources
Frequently asked
How can I see crime in my neighborhood?
Check your local police department's online crime map or open data portal, which typically shows reported incidents by block, type, and date. For comparing cities or long-term trends, use the FBI's Crime Data Explorer.
What is NIBRS?
NIBRS is the FBI's National Incident-Based Reporting System, the national standard for crime reporting since January 2021. As of May 2024, all 50 states and Washington, D.C., were certified to report through it, covering 82% of the population.
Why do crime numbers look different between cities?
Raw counts ignore population size, so compare rates per 1,000 residents instead. Reporting habits, how departments classify incidents, and whether an agency submitted data that year also shift the numbers.